Dashboard Projects
Netflix Analytics Power BI Dashboard
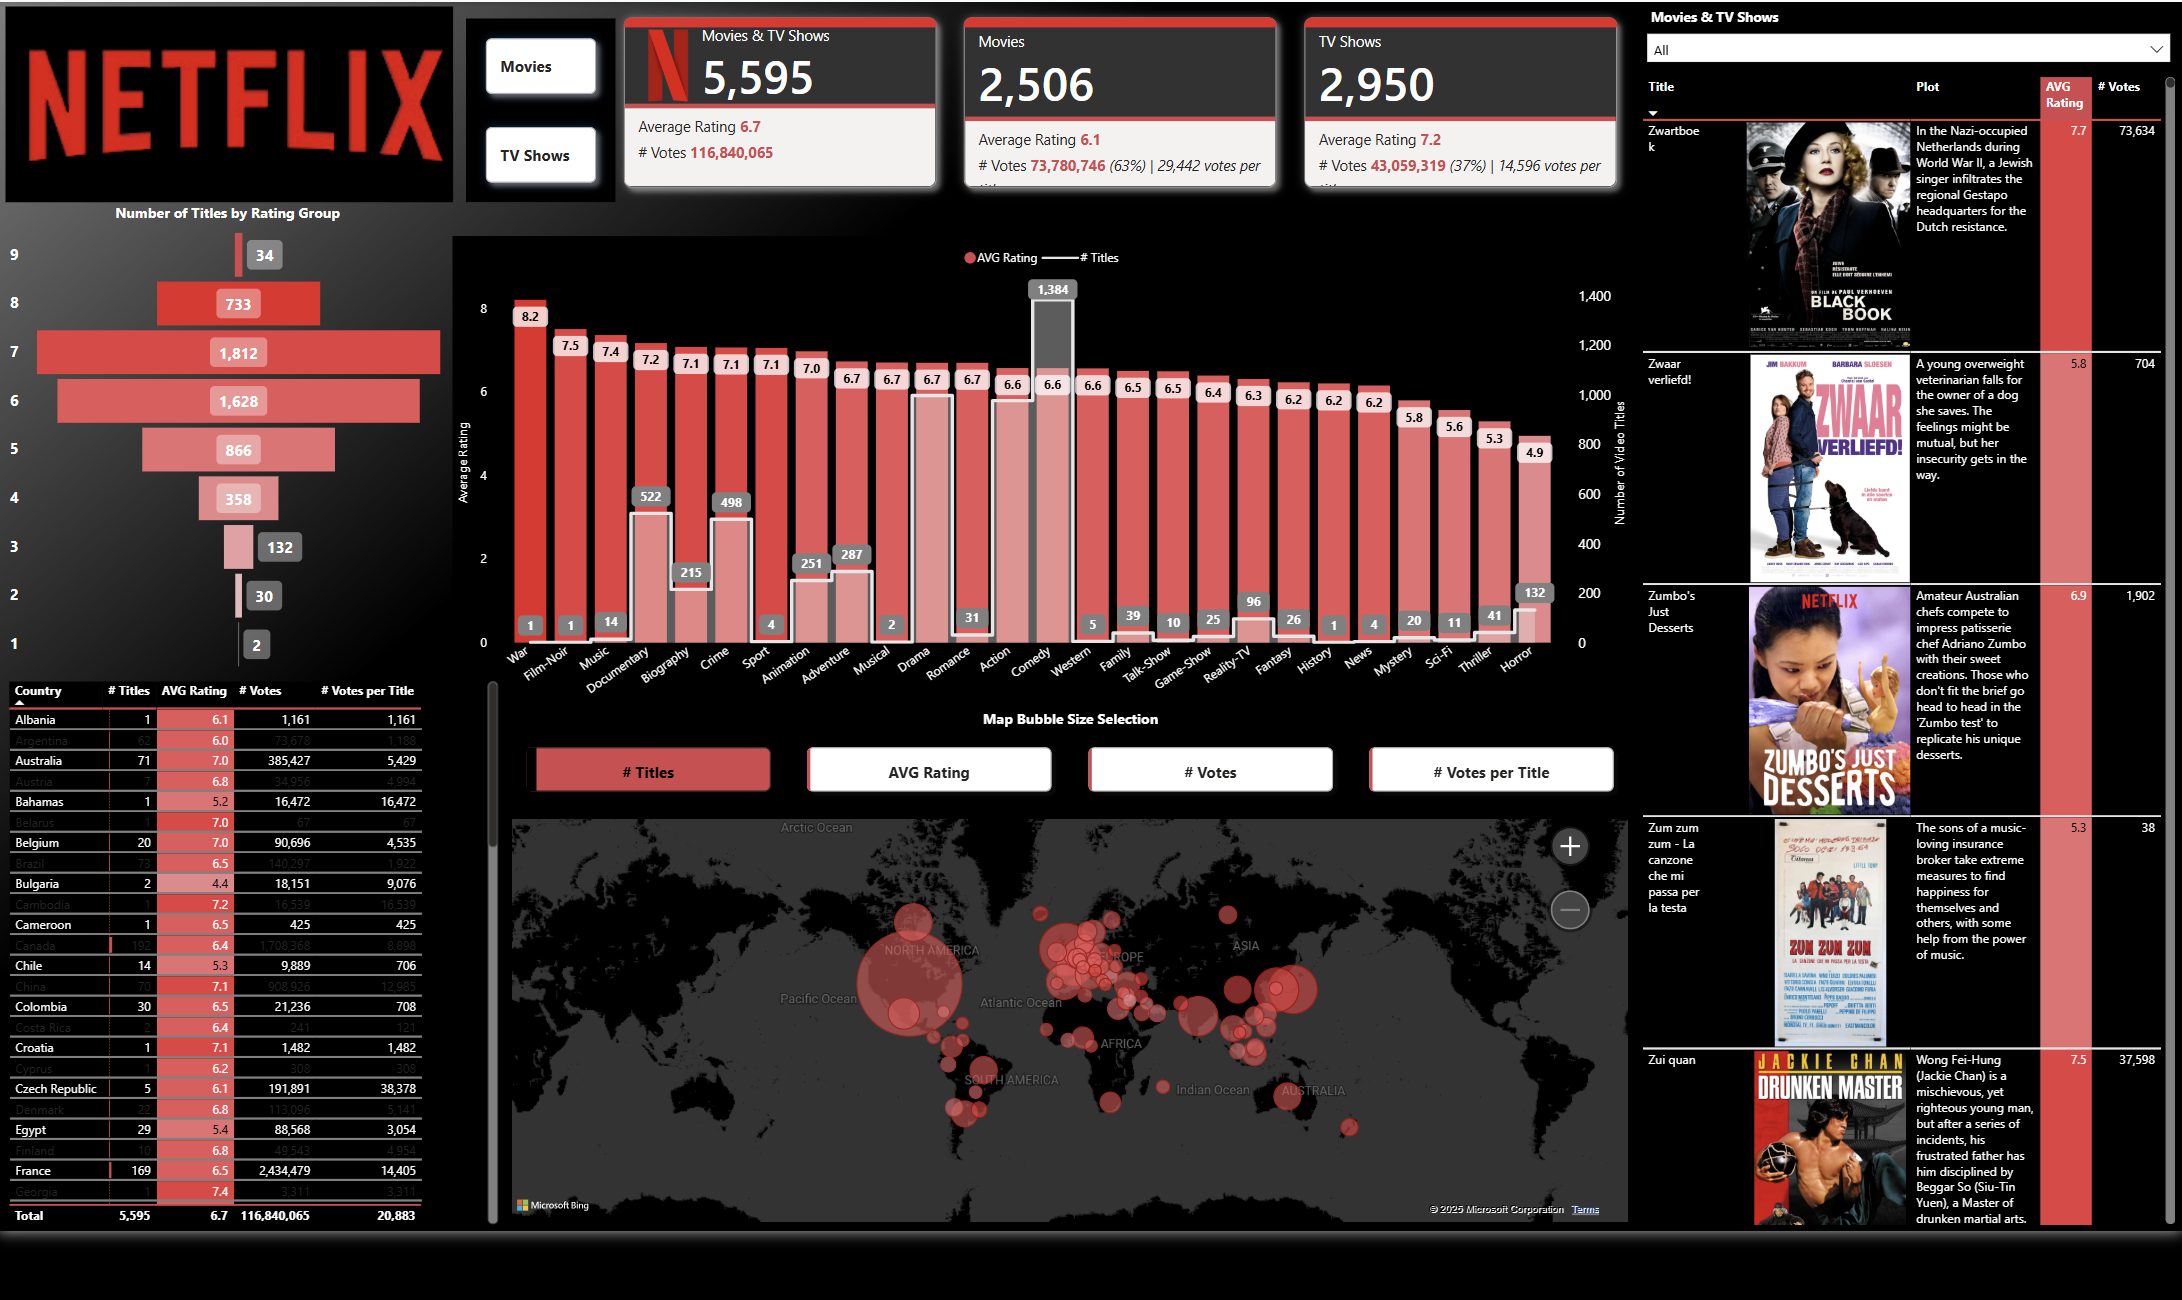
Provided analytics on ratings and votes, exploring variations across countries, genres, and titles. Imported and cleaned the Netflix dataset from Kaggle, handled \N values in runtime, and updated data types. Created background gradients, removed image backgrounds using Adobe's tool, and built gradients with Coolors. Added slicers with Movies/TV Shows buttons, map filter buttons, and built reference cards.
Live PreviewHR Analytics Power BI Dashboard
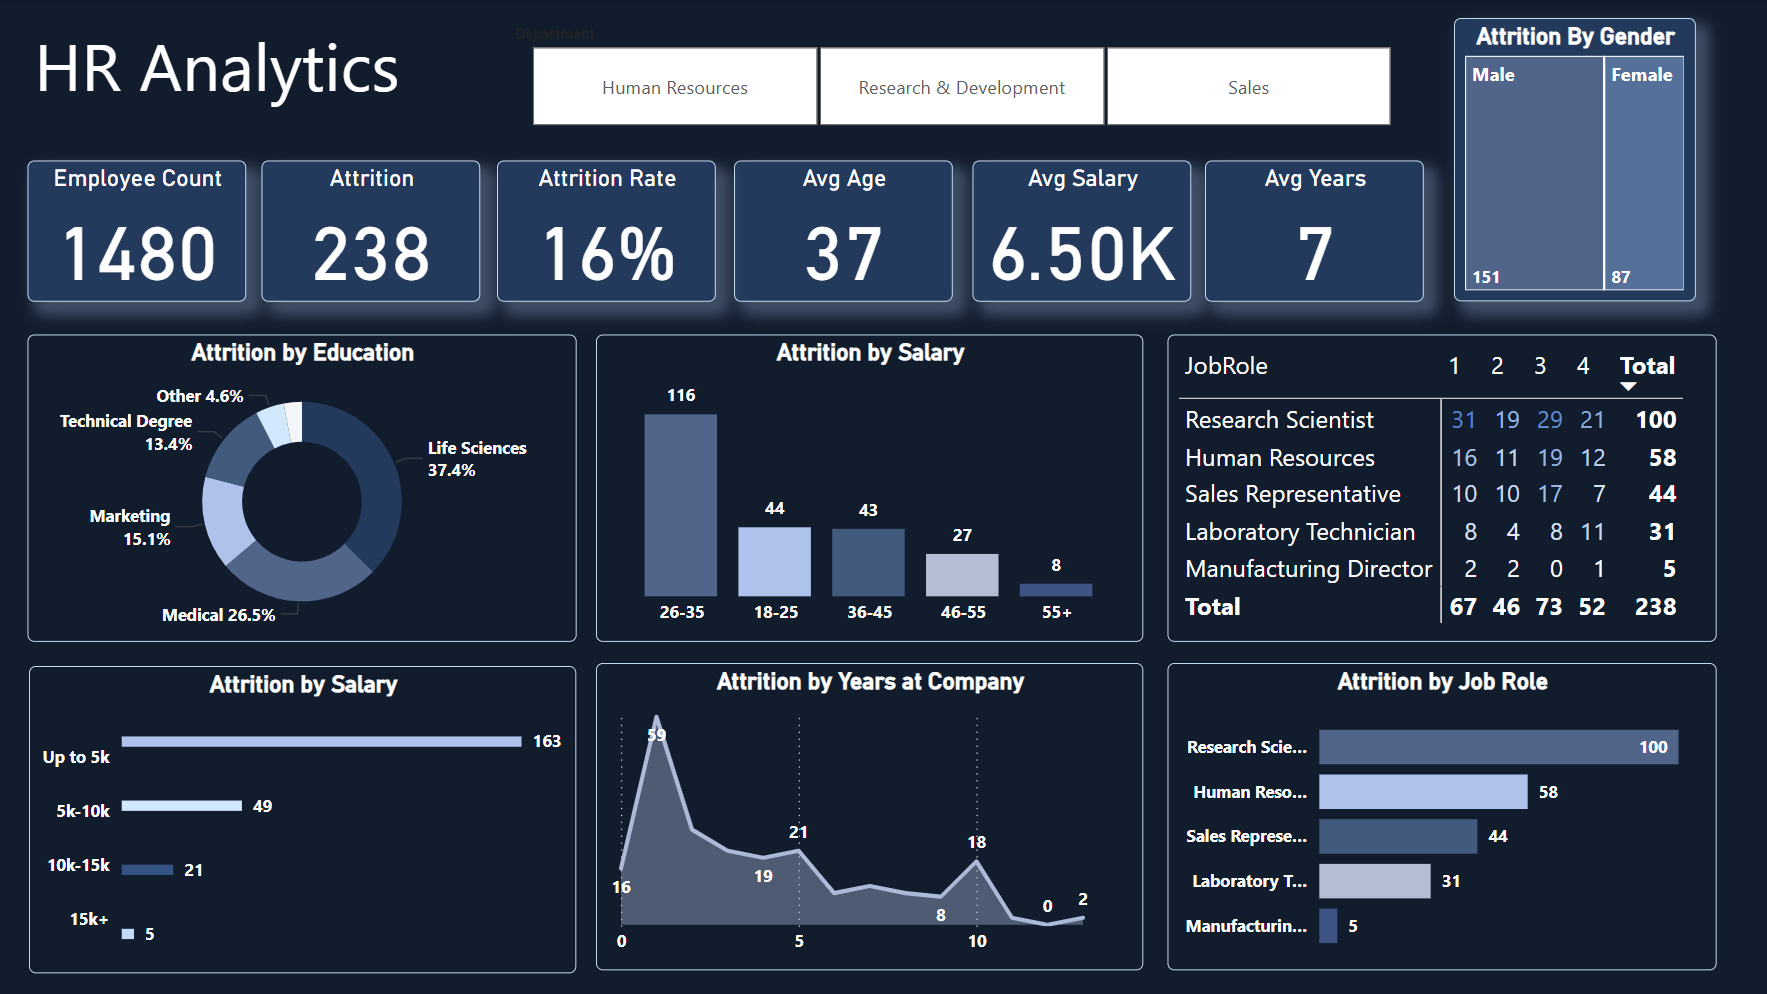
Provided analysis on employee attrition, examining patterns including departments, tenure, education, and job roles. Imported and cleaned the HR dataset in Power Query Editor. Created visually engaging reference cards and background gradients. Implemented slicers for and filters to allow in-depth exploration of employee turnover trends.
Live PreviewCall Center KPI Dashboard
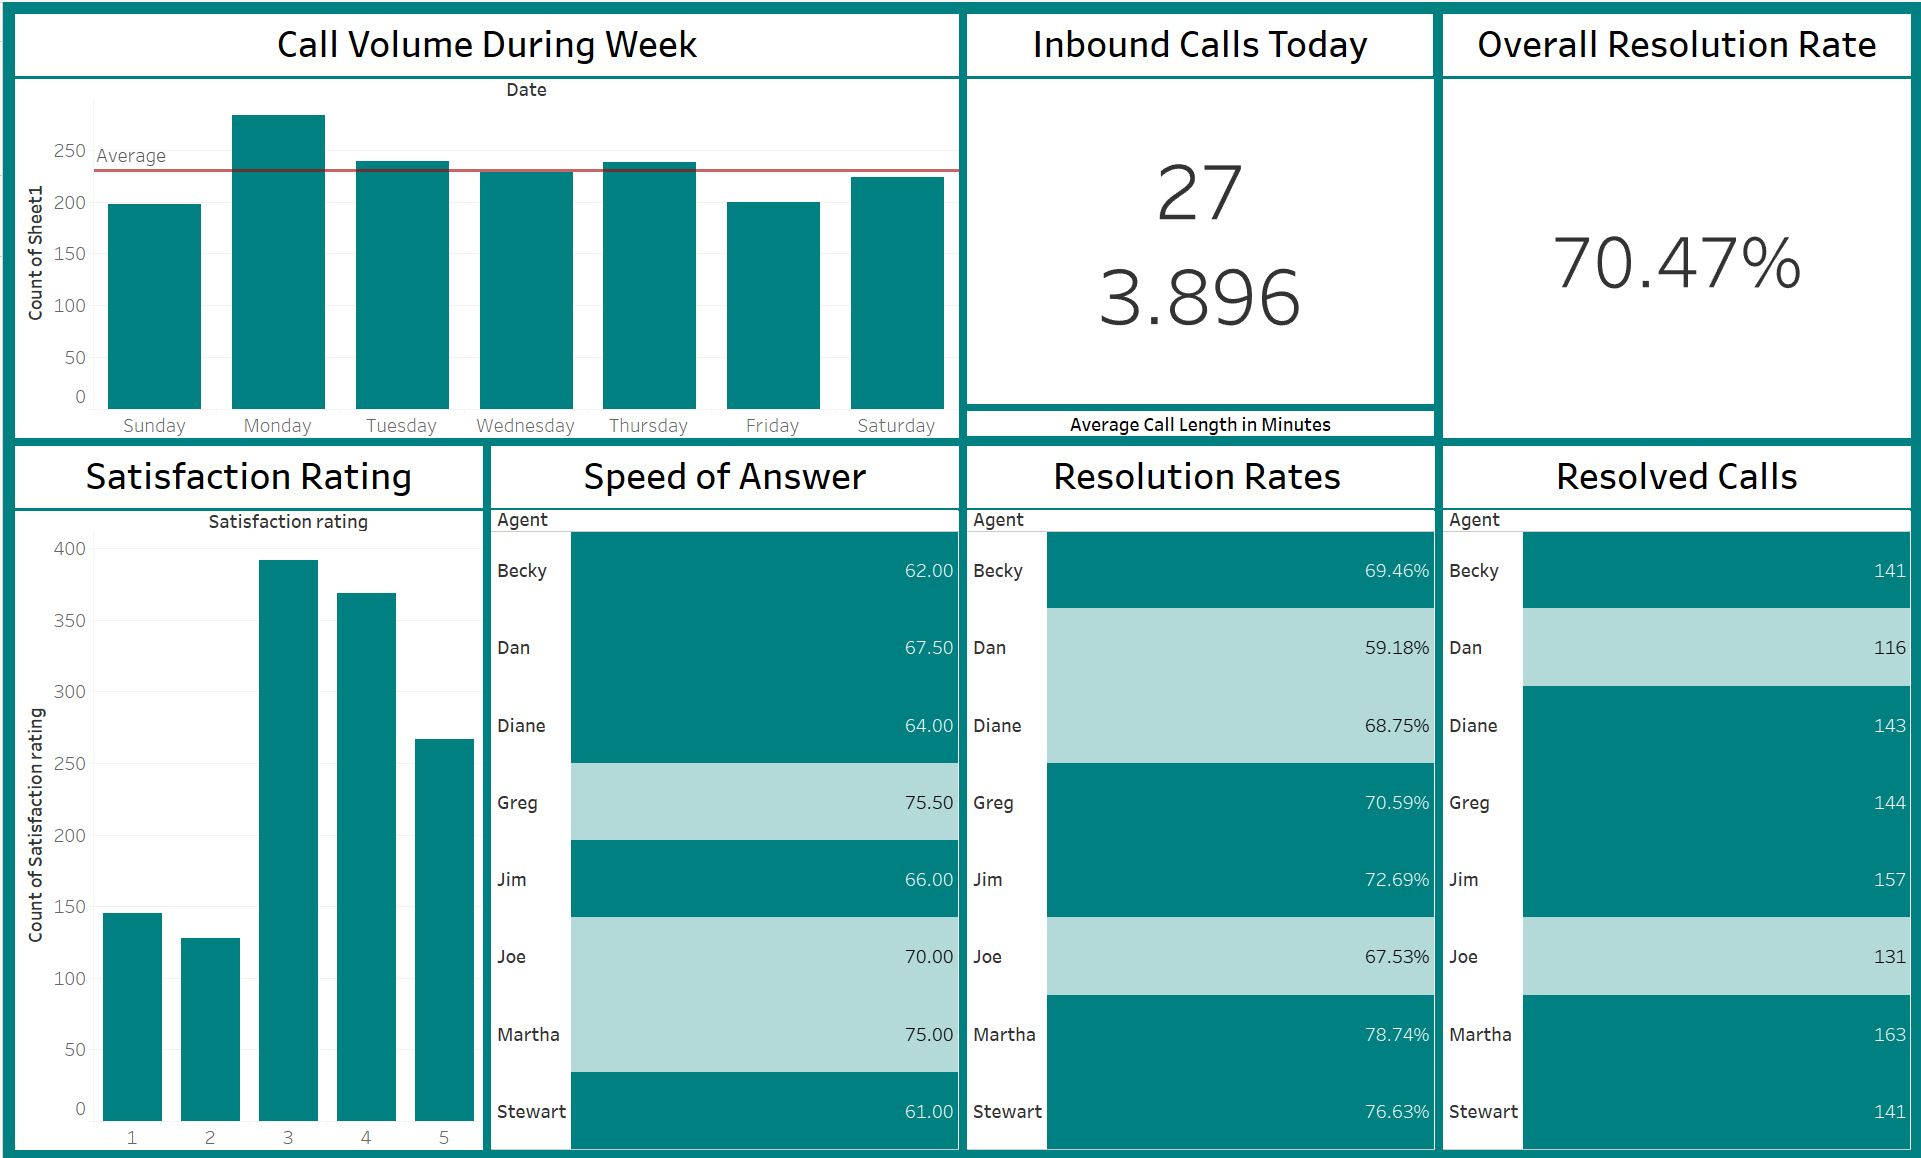
Created by using calculated fields to clean and transform Time and Average Talk Duration data. Implemented a date-based calculation to identify the most recent month of data and applied analytics for an average line on recent call volume. Visualized call volume trends during the week, and highlighted satisfaction ratings for the current month alongside daily call metrics.
Live PreviewProfitability of Products Story
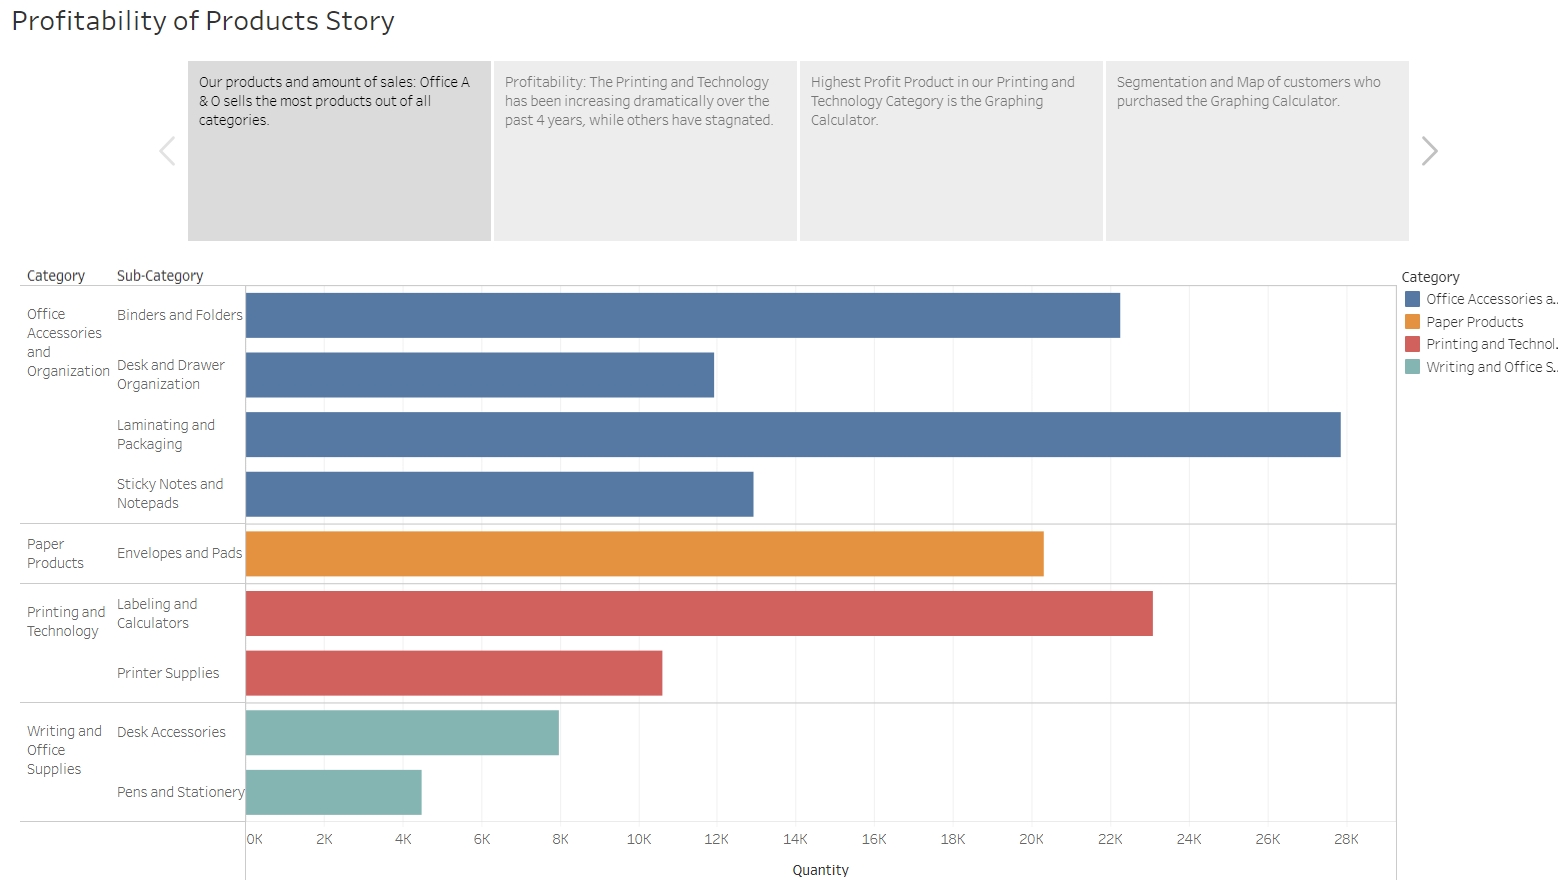
At a high level we look at product categories and subcategories. We then look at each category to identify which has the most actual profit: Printing and Technology. Filters are then used to identify the best-selling product in that category. Lastly a sector analysis to identify wh0 is purchasing the most from these subcategories (Individual Customers), providing insights into customer behavior.
LIVE PREVIEW